Robert M. Sholl

PhD student in statistics, Kansas State University

Portfolio

No. 73Statistical learning, modeling, and epidemiology

NameRobert M. Sholl

SubjectMixed models, nonlinear systems, and small samples

BegunAugust 2020

If found, please return to Dickens 009C

Ruled left, grid right. Pencil or pen.

Common distributions

DistributionKernelMeanVariance
Normal e−(x−μ)2/2σ2e^{-(x-\mu)^2/2\sigma^2} μ\mu σ2\sigma^2
Student t (1+x2/ν)−(ν+1)/2(1+x^2/\nu)^{-(\nu+1)/2} 00 ν/(ν−2)\nu/(\nu-2)
Chi-squared xk/2−1e−x/2x^{k/2-1}e^{-x/2} kk 2k2k
Exponential e−λxe^{-\lambda x} 1/λ1/\lambda 1/λ21/\lambda^2
Gamma xα−1e−βxx^{\alpha-1}e^{-\beta x} α/β\alpha/\beta α/β2\alpha/\beta^2
Beta xα−1(1−x)β−1x^{\alpha-1}(1-x)^{\beta-1} μ=αα+β\mu=\tfrac{\alpha}{\alpha+\beta} μ(1−μ)α+β+1\tfrac{\mu(1-\mu)}{\alpha+\beta+1}
Uniform 1,  a<x<b1,\; a<x<b a+b2\tfrac{a+b}{2} (b−a)212\tfrac{(b-a)^2}{12}
Binomial (nx)px(1−p)n−x\tbinom{n}{x}p^x(1-p)^{n-x} npnp np(1−p)np(1-p)
Poisson λx/x!\lambda^x/x! λ\lambda λ\lambda

The Heilmeier catechism

Contents

  1. Change of support page 1
  2. Expert elicitation page 3
  3. Partial differential equations page 5
  4. Network models page 7
  5. N-mixture models page 9
  6. Outbreak forecasting page 11
  7. Bayesian risk analysis page 13
  8. Agent-based models page 15
  9. Apps you can try page 17
  10. Papers, posters, talks page 19
  11. Teaching, service, CV page 21
  12. Get in touch page 23

I build statistical and mathematical models, primarily for public health, safety, and agricultural problems. I also consult and specialize in small, data-scarce experiments as well as longitudinal forecasting.

I initially trained in microbiology, food-safety, and clinical lab settings so I like knowing where data comes from and seeing the data generating process.

Subject Change of support When 2025 – now

Developing models for outcome-based water conservation

Kansas pays landowners to adopt practices for reducing and controlling nonpoint source pollution in water resources. I’m developing methods for applying GLMMs to join state databases so the Kansas Department of Agriculture can fund practices where each dollar has the highest impact.

yij∣bj∼Gamma⁡(μij,ϕ),bj∼N(0,σb2)ηij=log⁡(μij)=η+xij⊤β+bj\begin{gathered} y_{ij}\mid b_j\sim\operatorname{Gamma}(\mu_{ij},\phi),\quad b_j\sim N(0,\sigma_b^2)\\ \eta_{ij}=\log(\mu_{ij})=\eta+\mathbf{x}_{ij}^{\top}\boldsymbol{\beta}+b_j\end{gathered}

The attached poster was our proof of concept and led to the GLMM route.

Want more information?: Developing models for outcome-based water conservationPoster (PDF): Developing models for outcome-based water conservation

CSIMS spendingHUC-12, 2004 to 2025KDHE water qualityHUC-8, 1967 to 2024Kriging interpolationSpatial GLMMQuantify BMP outcomesLinear modelsKDA dashboard
Fig. 1. How the two state databases reach the model and, in the end, the dashboard.

Findings

  • The CSIMS cost-share database, 2004 to 2025, queried and tabled for the first time.
  • Predicts the outcome of best management practices in each HUC-12 at any time point.
  • Second runner-up in the graduate poster competition, 2025 Governor’s Water Conference.

Subject Expert elicitation When 2025 – now

Expert elicitation as a form of dimension reduction

Two decades of Kansas Department of Agriculture records hold 108 names for conservation practices, many of them duplicates. We turn experts’ groupings and exclusions into data inside a frequentist measurement-error model, so an expert counts as useful when their opinion narrows the confidence bands on practice effects.

L(β,η;O,E,X)=∏i=1ng(Ei∣Oi;η) ∏i=1nf(Oi;Xi,β)L(\beta,\eta;O,E,X) = \prod_{i=1}^{n} g(E_i \mid O_i;\eta)\,\prod_{i=1}^{n} f(O_i;X_i,\beta)

Want more information?: Expert elicitation as a form of dimension reductionPoster (PDF): Expert elicitation as a form of dimension reductionLele and Allen (2006): Expert elicitation as a form of dimension reduction

data only Two field experts0.857Academic expert0.015Non-expert heuristic0.922Principal components0.421Lasso0.66700.250.50.751Band width with the expert, over data only 67 times narrower
Fig. 2. Confidence band ratio for each expert dataset. Below 1, the expert added information.

Findings

  • The academic expert’s groupings gave a confidence band 1.5% as wide as the data alone (ratio 0.015).
  • All experts were informative, any grouping leads to less variance, but some experts are better than others.
  • One expert beat both principal components (0.421) and the lasso (0.667) at variable selection.

Subject Partial differential equations When 2024 – now

Mother-to-offspring spread in prion disease forecasts

Chronic wasting disease forecasts such as the diffusion model of Hefley et al. (2017) work only for the species they were built for, yet prions behave the same in every species. I propose adding mother-to-offspring transfer, to test whether that pathway matters and whether separating pathways lets one model forecast beyond deer.

∂u∂t=(∂2∂s12+∂2∂s22)[μ(s) u]+λ(s) u\frac{\partial u}{\partial t} = \Big(\frac{\partial^2}{\partial s_1^2} + \frac{\partial^2}{\partial s_2^2}\Big)\big[\mu(\mathbf{s})\,u\big] + \lambda(\mathbf{s})\,u

Want more information?: Mother-to-offspring spread in prion disease forecastsPoster (PDF): Mother-to-offspring spread in prion disease forecastsHefley et al. (2017): Mother-to-offspring spread in prion disease forecasts

new: mother to offspringprocess: diffusion + growthdata: CWD test resultsWisconsin DNRsurveillanceHefley et al.2017kept only ifthe data agree
Fig. 3. The three levels of the model. The bottom one is our proposal for a new pathway.

Findings

  • Adds a birth indicator to the Hefley et al. model; Bayesian variable selection keeps or drops it.
  • To be checked against the original model and a generalized additive model of incidence.
  • Built in R for Wisconsin DNR surveillance data, with forecasts mapped in GIS for managers.

Subject Network models When Personal project

Rabies in raccoon contact networks

How do infection and removal rates shape a rabies outbreak? I simulated stochastic SIR epidemics on a real 23-raccoon proximity network and on its 113-node rescaled twin, with the event-driven simulator, the network metrics and the epidemic threshold all written from scratch in base R.

τc=1λmax⁡(A)0.187 observed,    0.151 rescaled\begin{gathered}\tau_c = \frac{1}{\lambda_{\max}(A)}\\ 0.187 \text{ observed},\;\; 0.151 \text{ rescaled}\end{gathered}
Detailed write-up : Rabies in raccoon contact networks
0.10.31310050%100%Infection rate over removal rate (log scale)Raccoons infected 23 raccoons, observed113, rescaled network one curve for both
Fig. 4. Final outbreak size against the ratio of infection to removal rate, 10 runs per setting.

Findings

  • Outbreak size depends on the ratio of infection to removal rate alone, on both networks.
  • So raising removal works as well as cutting transmission, which supports removing and vaccinating.
  • Epidemic thresholds of 0.187 (observed) and 0.151 (rescaled), from each network’s largest eigenvalue.

Subject N-mixture models When Project on-hold

Forecasting state overdose deaths through the surge

Could state data from 2014 to 2018 have forecast overdose deaths in every state from 2019 to 2022? I compared lasso-selected quasi-Poisson GLMs, spline GAMs and hierarchical negative-binomial models fitted with a sampler I wrote by hand, all scored on the four held-out years.

log⁡μst=log⁡Nst+as+bs t+xst⊤βbs∼N(μb,σb2)\begin{gathered}\log\mu_{st} = \log N_{st} + a_s + b_s\,t + x_{st}^{\top}\beta\\ b_s \sim \mathcal{N}(\mu_b,\sigma_b^2)\end{gathered}
Detailed write-up : Forecasting state overdose deaths through the surge
GLM, lasso terms508 (76%)GAM, lasso terms513 (75%)Bayes, common trend521 (77%)GLM, DAG terms560 (75%)GAM, DAG terms624 (74%)Bayes, state trends959 (64%)Intercept only1,128 (66%)04008001,200Forecast error, deaths per state-year (90% interval coverage) a near tie
Fig. 5. Forecast error by model, best first, with coverage of the 90% intervals in brackets.

Findings

  • A quasi-Poisson GLM with state effects forecast best: RMSE 508 deaths, median error 13%.
  • The hierarchical Bayesian model came within 3% (RMSE 521) with the best coverage, 77% of 90% intervals.
  • Giving each state its own trend overfit (RMSE 959), and no model foresaw the fentanyl surge.

Subject Outbreak forecasting When Project on-hold

What makes a norovirus outbreak at sea large?

Using 63 norovirus outbreaks reported to the CDC Vessel Sanitation Program from 2014 to 2019, I modelled the share of people aboard who fell ill with beta-binomial regression, compared ship size, voyage length, season and departure region, and checked every model with leave-one-out cross-validation.

yi∼BetaBinomial(ni, μi, ρ)logit⁡μi=xi⊤β\begin{gathered}y_i \sim \mathrm{BetaBinomial}(n_i,\,\mu_i,\,\rho)\\ \operatorname{logit}\mu_i = x_i^{\top}\beta\end{gathered}
Detailed write-up : What makes a norovirus outbreak at sea large?
median 4.0% 02,0004,0006,0008,00005%10%15%20%People aboardPassengers and crew ill two outbreakscarry the effects Largest outbreaks: 19.93% of 1435 aboard and 16.26% of 4237.
Fig. 6. Share of passengers and crew who fell ill, by the number of people aboard, in 63 outbreaks.

Findings

  • Attack rates cluster around 4% at any ship size: odds ratio 1.03 per doubling of people aboard.
  • The full model had the best AIC but the worst cross-validated score; its effects rest on two outbreaks.
  • Outbreaks are more frequent from December to April, but no larger.

Subject Bayesian risk analysis When Consulting

Buying a home in Manhattan, Kansas, priced for risk

Due diligence on six inspected houses in Manhattan, Kansas: what the inspections will cost, how likely buying is to beat renting, what an early move could cost, and how each would do as a rental. The forecasts come from a Bayesian model of local prices.

gt=μ+ϕ (gt−1−μ)+εt,εt∼N(0,σ2)g_t = \mu + \phi\,(g_{t-1}-\mu) + \varepsilon_t,\quad \varepsilon_t \sim \mathcal{N}(0,\sigma^2)

The prior on the long-run growth μ comes from inflation.

Detailed write-up : Buying a home in Manhattan, Kansas, priced for risk
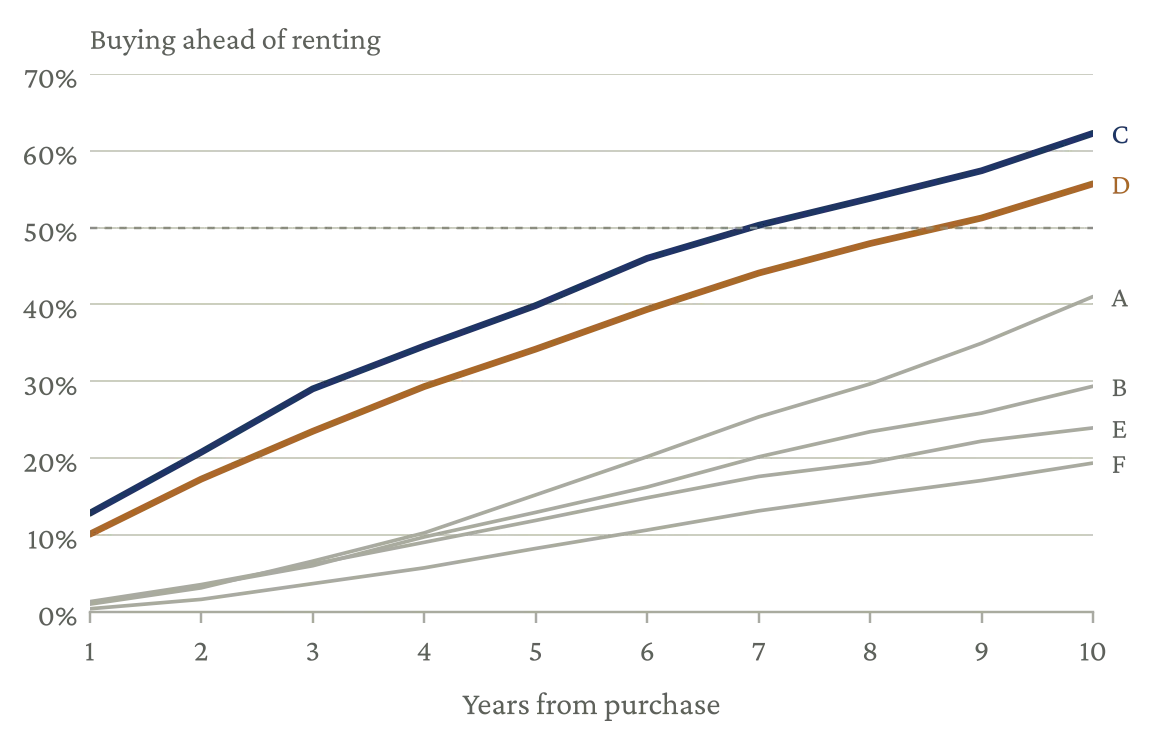
Six rising lines, one per house, showing the chance that buying beats renting climbing from near zero in year one to between about 20% and 60% by year ten, with the two soundest houses well above the rest.
Fig. 7. Chance that buying beats renting, by year from purchase, for each of the six houses.

Findings

  • Four of the six need $38,000 to $48,000 of repairs, mostly roofs and foundations.
  • Only Houses C and D are worth offers, near $206,000 and $193,000.
  • Each house has a 5% chance of being underwater in year three.

Subject Agent-based models When Consulting

Frederick County housing, built buyer by buyer

An agent-based model of the housing market in Frederick County, Maryland. Owners, renters, investor firms and flippers each follow a few plain rules, and prices, rents and sales emerge from their trades. Switching rules off one at a time shows what drives the market.

ΔPtPt−1=κ 6−St6,St=homes for salemonthly sales\frac{\Delta P_t}{P_{t-1}} = \kappa\,\frac{6 - S_t}{6},\qquad S_t = \frac{\text{homes for sale}}{\text{monthly sales}}

S is months of supply; six is a balanced market.

Detailed write-up : Frederick County housing, built buyer by buyer
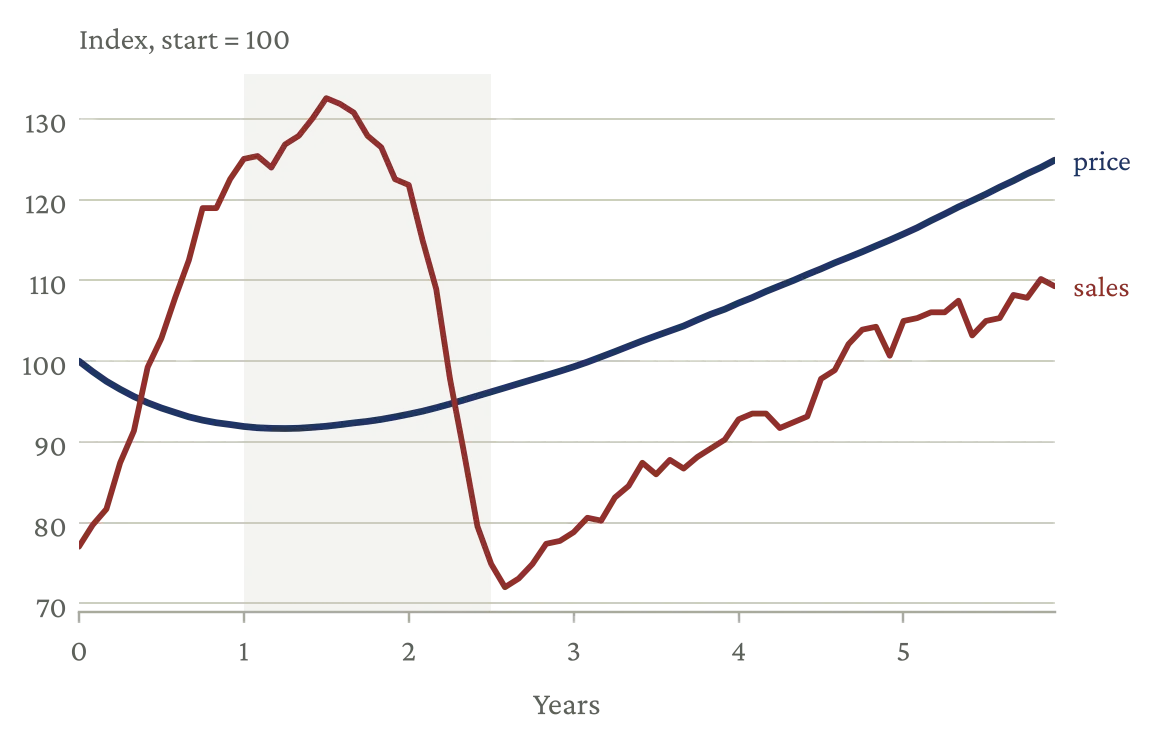
Two indexed lines over six model years, with rates rising from 3% to 7% in years one to two shaded. Sales jump, then fall sharply below the starting level and recover only partly; price dips slightly and then climbs past its start.
Fig. 8. A rate rise from 3% to 7%, price and sales indexed to 100: sales fall while the price holds.

Findings

  • When rates jump from 3% to 7%, sales fall 17% while prices hold. Without rate lock-in, sales would rise.
  • Owners who won’t sell below what they paid keep prices up, and many rent their homes out instead.
  • To 2030, prices rise about 28% whatever rates do, while sales drift 15 to 18% lower as affordability tightens.

Bootstrap Lab

Open in a new tab
Bootstrap Lab A small working copy. Try the controls.
Open the full app: Bootstrap Lab

Papers and posters

  1. Horn, C. , Sholl, R. M. , Haskell, D. , Hebbar, S. and Zinovyeva, A. (2020). Two new CRISPR-generated alleles in the C. elegans mir-1022 gene. microPublication Biology.
  1. Sholl, R. M. and Hefley, T. J. (2026). Mining the mind: expert elicitation as a form of dimension reduction. Governor’s Conference on the Future of Water in Kansas.
  2. Sholl, R. M. and Hefley, T. J. (2025). Spatio-temporal models for optimizing water conservation practices. Governor’s Conference on the Future of Water in Kansas. Second runner-up, graduate poster competition.
  3. Sholl, R. M. and Hefley, T. J. (2024). Forecasting disaster: adding a human touch to animal disease predictions. Research and the State, Kansas State University.
2020202120222023202420252026papersposterstalks
Papers, posters and talks by year.
  • Solving problems with data
    ASA DataFest workshop, Kansas State University, 2026
  • Presenting ideas as a data scientist
    ASA DataFest workshop, Kansas State University, 2025

Teaching

  • Biometrics II STAT 341

    Graduate teaching assistant, Spring 2026. Applied regression for biological problems.

  • Biometrics I STAT 240

    Graduate teaching assistant, Spring and Fall 2025. Introductory statistics for the biological sciences, taught two semesters running.

  • Introduction to Statistics STAT 225

    Graduate teaching assistant, Fall 2024. Built the coursework and lectured on sampling, probability, set theory, regression and distributions.

  • Guest lectures, STAT 705 Regression and ANOVA
  • Consulting for K-State graduate researchers
  • Linux From Scratch docs and testing, 2021–23
PhD, StatisticsKansas State University
expected 2028
MS, Statistics & Data ScienceKansas State University
2026
BS, MicrobiologyKansas State University
2021
Statistical consultantIndependent
2024 – now
Graduate research fellowKansas Water Institute
2025 – now
Second runner-up, graduate poster competitionGovernor’s Water Conference, Kansas, 2025
Lolafaye Coyne Summer Research ScholarshipKansas State University, three summers, 2026

See full CV

Get in touch

I’m always interested in hearing about collaborations in the biological or agricultural sciences. I’m also happy to discuss my services as a consultant in statistical or mathematical modeling, invitations to speak, guest lecture, or run a workshop.

  • Development of a statistical or mathematical model
  • Consulting on small or data-scarce studies
  • A workshop on modeling, statistical methods, data science, or scientific communication
  • Any problem in forecasting, statistical learning, or AI. I promise, I’m interested!

GitHubGoogle ScholarLinkedIn

I review every message personally, so please allow several business days for a reply. I look forward to working with you!

Next

  • query and table the CSIMS records (done)
  • connect CSIMS with ambient quality data (done)
  • test GLMM generation (done)
  • rerun expert interviews
  • find more consulting projects

Conversions

1 ft³/s0.02832 m³/s
1 acre-foot1,233.5 m³
1 mg/L in water1 ppm
1 mi²2.590 km²
1 hectare2.471 acres
1 lb/acre1.121 kg/ha
1 lb0.4536 kg

Portfolio No. 73 Robert M. Sholl, Department of Statistics, Kansas State University

Cover

Curriculum vitae

Download as PDF

Robert M. Sholl

Statistician and data scientist. Bayesian modelling, statistical consulting, AI and LLM workflows.

Manhattan, Kansas, and remote

Statistics PhD student and data scientist with an MS in Statistics and Data Science and more than three years of applied consulting. I build Bayesian, survival, spatio-temporal and regression models for federal, state and private clients, including the USDA National Bio and Agro-Defense Facility and the Kansas Department of Agriculture, and I design AI agent and LLM workflows that automate research operations. A background in microbiology and laboratory science gives me depth in biological, agricultural and environmental data.

Education

PhD, Statistics expected spring 2028

Kansas State University, Manhattan, KS

MS, Statistics and Data Science August 2026

Kansas State University

BS, Microbiology May 2021

Kansas State University

Research and consulting

Statistical consultant January 2026 – present

National Bio and Agro-Defense Facility (USDA), Manhattan, KS

  • Advise scientists at a federal agricultural biosecurity laboratory on new applications of Bayesian survival analysis.
  • Design modelling approaches that give reliable estimates from small, data-scarce experiments.
  • Translate model results and uncertainty into clear guidance for research decisions.

Graduate research fellow, Kansas Water Institute July 2025 – present

Kansas State University

  • Quantitative researcher on joint projects with the Kansas Water Institute, the Kansas Department of Agriculture and SAS.
  • With Dr. Trevor Hefley, built a spatio-temporal framework for allocating best management practice funding to control nonpoint source pollution in Kansas water.
  • Presented the framework at the 2025 Governor’s Conference on the Future of Water in Kansas, placing second runner-up in the graduate poster competition.

AI and data consultant summer 2026

Vero Creative, Manhattan, KS

  • Researched, designed and built networks of AI agents that automate market research for a regional marketing firm.

Statistical consultant August 2024 – present

Independent and Kansas State University

  • Consult with graduate researchers across disciplines on experimental design, analysis and interpretation.
  • Manage several client engagements at once, from scoping to final deliverables.

Statistical and data consultant 2024 – 2025

BBT Live, Manhattan, KS

  • Overhauled data management, led website development and streamlined internal workflows with analytics.

AI implementation specialist June – September 2023

Cohen-Esrey, Merriam, KS

  • Found where AI could improve company processes, trained staff to use it, and built AI-assisted training modules for low-income housing tax credit property management.

Teaching

Graduate teaching assistant August 2024 – May 2026

Department of Statistics, Kansas State University

  • Built the coursework and lectured for STAT 225, Introduction to Statistics (fall 2024).
  • Guest lectures and support for STAT 705, Regression and Analysis of Variance (fall 2024).
  • Taught STAT 240, Biometrics I (spring and fall 2025), and STAT 341, Biometrics II (spring 2026).

Publications, posters and workshops

Sholl, R. M., and Hefley, T. J. (2026). Mining the mind: expert elicitation as a form of dimension reduction. Poster, Governor’s Conference on the Future of Water in Kansas.

Sholl, R. M., and Hefley, T. J. (2025). Spatio-temporal models for optimizing water conservation practices. Poster, Governor’s Conference on the Future of Water in Kansas. Second runner-up, graduate poster competition.

Sholl, R. M., and Hefley, T. J. (2024). Forecasting disaster: adding a human touch to animal disease predictions. Poster, Research and the State, Kansas State University.

Solving problems with data: problem framing, cleaning messy data, choosing tools and delivering solutions. Workshop, ASA DataFest, Kansas State University, 2026.

Presenting ideas as a data scientist: scientific communication across disciplines. Workshop, ASA DataFest, Kansas State University, 2025.

Horn, C., Sholl, R., Haskell, D., Hebbar, S., and Zinovyeva, A. (2020). Two new CRISPR-generated alleles in the C. elegans mir-1022 gene. microPublication Biology. doi:10.17912/micropub.biology.000233

Skills

Programming

R, Python, SQL, SAS, Stan, JAGS, Git and GitHub.

Statistical modelling

Bayesian inference and hierarchical models, Bayesian survival analysis, spatio-temporal models, linear and generalized regression, ANOVA, experimental design, probability and distribution theory.

Data science

Predictive modelling, optimization, data cleaning and wrangling, exploratory analysis, visualization and data management.

AI and automation

AI agents and multi-agent systems, LLM workflow automation, prompt engineering and AI adoption training.

Communication

Statistical consulting, technical writing, scientific presentations, teaching and work with non-technical decision makers.

Awards and service

Second runner-up, graduate poster competition November 2025

Governor’s Conference on the Future of Water in Kansas

Lolafaye Coyne Scholarship for Summer Research 2024 – 2026

Kansas State University, three consecutive summers

Open-source volunteer, Linux From Scratch 2021 – 2023

Documentation and quality assurance for a global open-source project

Eagle Scout May 2015

Boy Scouts of America

Earlier experience

Customer fulfillment and RealPage support specialist 2022 – 2023

Cohen-Esrey, Merriam, KS

Supported bookkeeping and financial management for more than 80 properties; system administrator and staff instructor for RealPage.

Screening chemist 2022

Clinical Reference Laboratory, Lenexa, KS

High-throughput toxicology immunoassay screening and specimen validity testing; QC troubleshooting and maintenance on a Beckman AU5800 analyzer.

Lab technician and research assistant 2016 – 2018

KSU Food Safety and Defense Lab, Manhattan, KS

Data acquisition for industry-sponsored food process validation studies; BSL-2 and BSL-3-Ag compliance and training.

General manager, hospitality 2018 – 2021

Heritage Brewpub and Heritage Brewing Co. (Virginia), Tubby’s (Manhattan, KS)

Payroll, inventory, supply planning and staff training. Cicerone certified.

Detailed write-up

Open in a new tab